Awk is an ancient and powerful tool for working with raw text. Being a command-line utility, it can be overkill in certain situations. At other times, it’s the only thing that can get the precision you need for manipulating text.
Having been created in the 1970s at Bell Labs, it’s been around for a long time. This is useful because it means that awk is probably available in most terminal sessions you start. It also means that the resources available for learning awk don’t lose their relevance. While you can certainly use a search engine to find tutorials, the best resources I learned from were:
- Awk – A Tutorial and Introduction – by Bruce Barnett
- Lots of detailed, free information. A somewhat dated site theme, but you’re learning awk, right?
- Sed & Awk – by Dale Dougherty, Tim O’Reilly
- Great writing and examples. Especially useful if you are wanting to learn about Sed as well.
Ok, so that covers how to learn awk, but maybe you’re not convinced about why you should learn it. The rest of this post will take a deeper look into how I include this tool into my workflow.
Why use awk?
If all you are doing is trying to search for the occurrence of a string within a block of text, then awk is probably overkill. In those situations, I turn to grep, with commands that look something like this:
cat access.log | grep " 500 "
grep " 500 " access.log
The above commands search a file called access.log for any string that has a space, the number 500, and another space. This is a quick way to check for server 500 errors, like those that are reported in an nginx access log that’s exported from Flywheel’s server.
Grep can perform more powerful searches using regex, however, I turn to awk when I find myself starting to ask more advanced questions that require searching for one thing but printing another. Here are some examples of those kinds of questions:
- What is the distribution of HTTP response codes for the server? What about for a specific site?
- What IPs, and how many times have those IPs attempted to access the
wp-login.phpfile for a site? - What urls are experiencing 50x server errors?
We’ll get into the actual examples for the above questions later, but first let’s get a quick overview of how to use awk so that if you need to tweak things, you know where to start looking.
Basic Usage
Awk works by searching for strings and then doing something when it finds those strings. You can break down an awk command into this simple structure:
pattern { action }
The “pattern” part is a description of what lines awk should act upon. The “action” part of an awk statement is wrapped in curly braces and describes what should be done when a match is found.
Since awk is a command-line tool, we wrap the “awk program” that we want to run with single quotes. Here’s an awk command that does the same thing that the above cat and grep commands do:
awk '$0 ~ /500/ { print $0 }' access.log
To break this down into plain English:
awkwill execute the program within the two single quotes'...'on theaccess.logfile.- The program will first search each line (the
$0part), and only do something if there is a 500 within it.$0 ~ /500/.- Note: This looks more complex than grep because it is a regex statement.
- In this case, the awk program prints the whole line
{ print $0 }.- Note: Printing is the default behavior of awk, so the above could have been simplified to:
awk '$0 ~ /500/' access.log
A little more complex usage
The above doesn’t give us much benefit beyond what we can do with grep, but we can use awk to ask more complex things.
When awk runs, it breaks each line into fields that we can operate on. You can think of these fields like the cells in a spreadsheet. We can reference these fields by using a dollar sign and the number of the field. So $0 is the whole line, while $1 is the first field, $2 is the second field, and so on.
If we take a look at an example line from our access.log file which is basically the the default, nginx “combined” format, awk understand the line like so:
69.162.124.230 - - [22/Jan/2018:06:25:05 +0000] "HEAD / HTTP/1.1" 500 0 "http://example.com/" "Mozilla/5.0+(compatible; UptimeRobot/2.0; http://www.example.com/)"

Awk sees the line like this:
* $01 == 69.162.124.230
* $02 == -
* $03 == -
* $04 == [22/Jan/2018:06:25:05
* $05 == +0000]
* $06 == "HEAD
* $07 == /
* $08 == HTTP/1.1"
* $09 == 500
* $10 == 0
* $11 == "http://example.com/"
* $12 == "Mozilla/5.0+(compatible;
* $13 == UptimeRobot/2.0;
* $14 == http://www.example.com/)"
With some special fields:
* $0  == The whole line
* $NF == The last field
Knowing that awk breaks things down this way allows us to start searching exactly through one field and doing something with another field.
For example, we can find all lines that have a 500 HTTP response code (the ninth field), but only print the IP address for that request:
$ awk '$9 ~ /500/{ print $1 }' access.log
69.162.124.230
... lots more IPs ...
Getting more info with additional tools
Since this is the command line, we can use the output of our awk command as the input for other commands. I often will pipe the output of an awk command to both sort and uniq -c to count of the number of times something is printed from awk.
The uniq unix command selects only the unique lines, but requires those lines to be next to each other. Because of this, you will often see me pipe awk to sort and then to uniq. Finally, since there will be a count of the number of things that have happened, I will pipe the output one more time to sort -h, which will give us an ascending list. That general pattern looks something like this:
awk 'pattern{action}' file.log | sort | uniq -c | sort -h
Awk Cheatsheet for working with access.log
Great, you know enough about awk to be dangerous! 🙂 Maybe you need a little inspiration. Here are a few examples of questions I ask myself, and the terminal command that I use to get a better understanding of an nginx access log.
What is the distribution of HTTP response codes for the server?
Because the HTTP response code is the ninth field in the default nginx combined log, we just need to print that field, sort and count the results! In this case, you can see that by far the highest response is a 200 — great! There are a handful of 50x codes and some 40x codes, but overall, this log doesn’t look too bad.
$ awk '{print $9}' access.log | sort | uniq -c | sort -h
      1 499
      4 504
     13 400
     23 503
     30 500
     36 401
     52 403
     88 405
    247 304
   1057 302
   2774 301
   4522 404
  53296 200
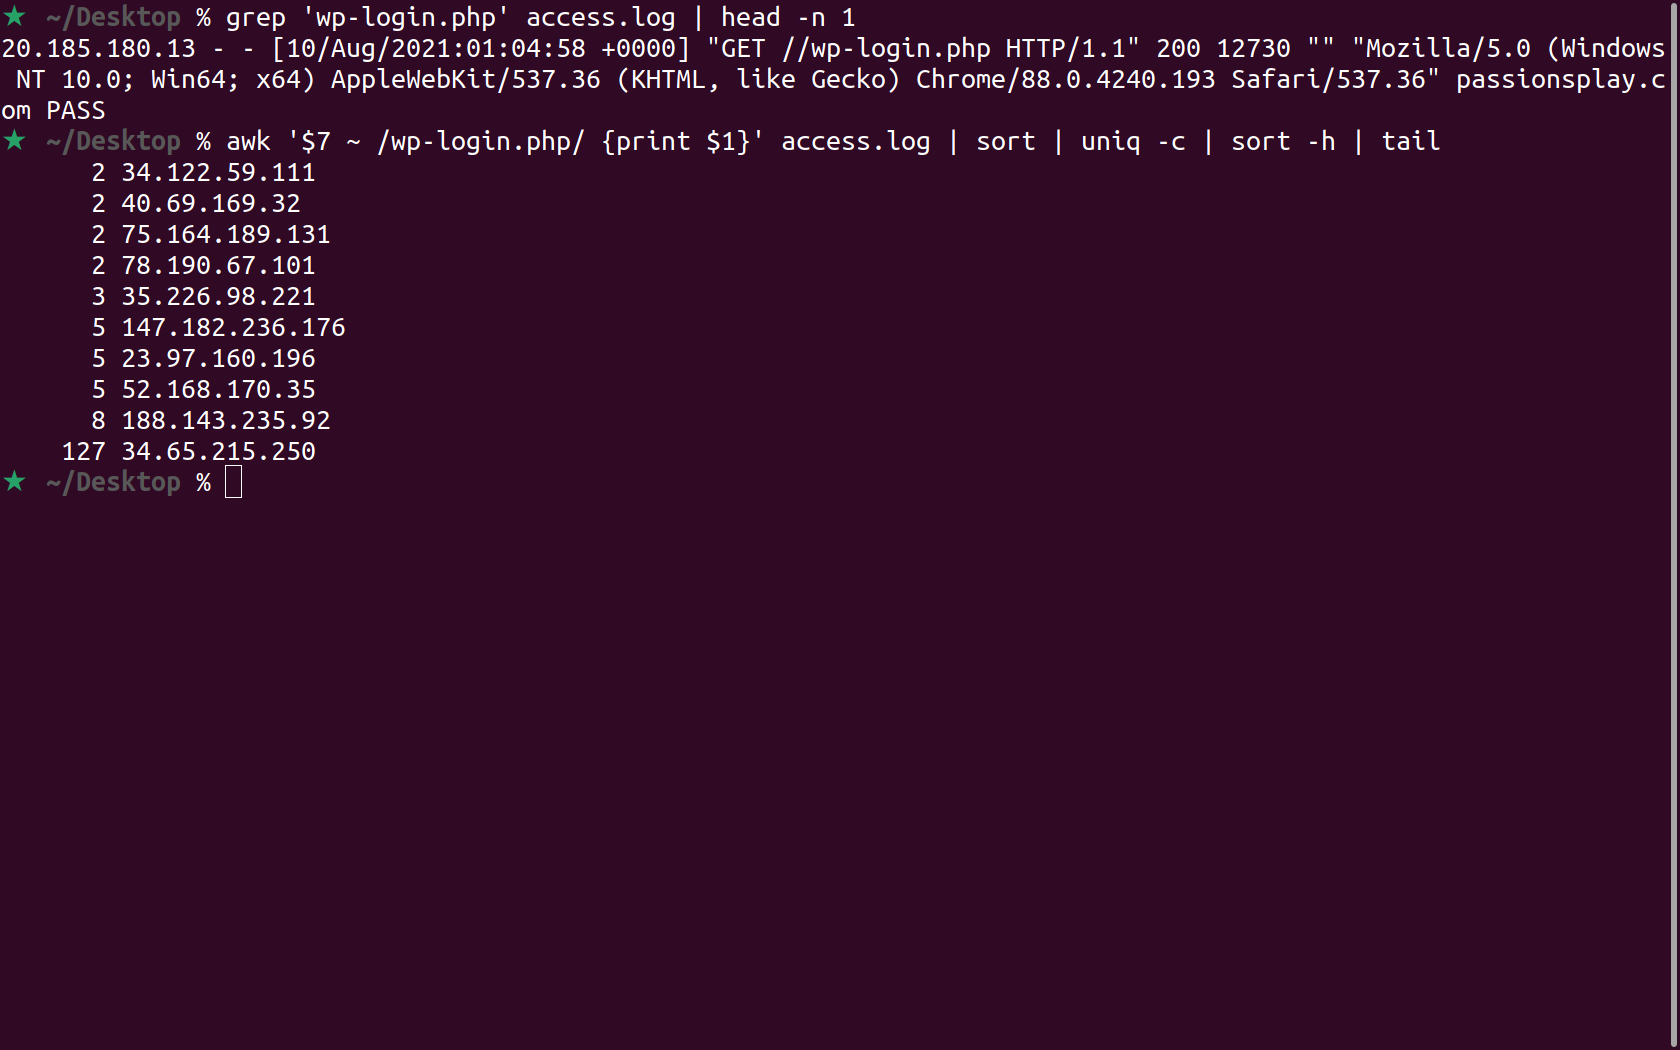
What IPs, and how many times have those IPs attempted to access the wp-login.php file?
The seventh field is often then request field and the first field is the IP address. Especially if there’s some sort of bot attack in progress, there might be a large number of different IPs. We can pipe all of our results to the tail command so that only the top ten results are printed.
$ awk '$7 ~ /wp-login.php/ {print $1}' access.log | sort | uniq -c | sort -h | tail
     15 34.209.136.220
     16 85.140.40.253
     18 46.161.9.3
     23 118.190.78.53
     23 185.85.191.196
     24 177.72.199.27
     28 194.6.231.240
     39 85.97.250.114
    118 2002:c1c9:e0d2::c1c9:e0d2
    360 193.201.224.210
What urls are experiencing 50x server errors?
In this case, we’re using a regex to give us all the lines that have a 50x response and print the request url. This can be useful in seeing if there are wide-spread site issues, or only problems on one specific page.
benjamin@fwxxxxxx:~$ awk '($6 ~ /POST/ && $9 ~ /50[0-9]/){print $7}' /flywheel/logs/access.log | sort | uniq -c | sort -h
      1 /jquery-file-upload/server/php/
      1 /text.php
      2 /
      2 /product-16/
      2 /wp-content/plugins/apikey/ini.php
      2 /wp-post.php
     13 /product-12/
Leave a Reply